Keynote
Unveiling complex graphene structures using SPELEEM
1Elettra - Sincrotrone Trieste, Italy
2Department of Physics, University of Trieste, Italy
3IOM-CNR Laboratorio TASC, Italy
4Abdus Salam International Centre for Theoretical Physics, Italy
5IOM-CNR Democritos, Italy
In my talk, I will illustrate the present capabilities of SPELEEM applied to graphene research, reporting examples of structural determination in combination with complementary STM measurements and ab-initio calculations. I will focus in particular on the characterization of complex, laterally inhomogeneous, graphene films grown on Ir(100), describing their rich structural diversity. These films exhibit coexisting physi-sorbed and chemisorbed graphene phases (see Figure 1a), providing a notable exam-ple of a model where the substrate-film interaction can be tuned by temperature, through the formation and rupture of a surprisingly small fraction of chemi-sorption bonds. The effect on the local electronic structure of the film will be discussed [1]. In the second part of the talk, I will address issues concerning the structure of graphene irradiated with low energy Ar and Ne ions [2]; I will describe in particular the evolution of the surface upon thermal treatment. Ar atoms remain trapped under graphene, where they form clusters reaching lateral size up to tens of nanometers and height of several atomic layers (Figure 1b,c). Much larger structures, nearing 100 nm in diameter, are obtained for the case of Ne, owing to the faster diffusion with respect to the case of Ar. XAS-PEEM measurements demonstrate that Ne is not solid, pointing to the occurrence of a solid-liquid transition in the bubbles [3].
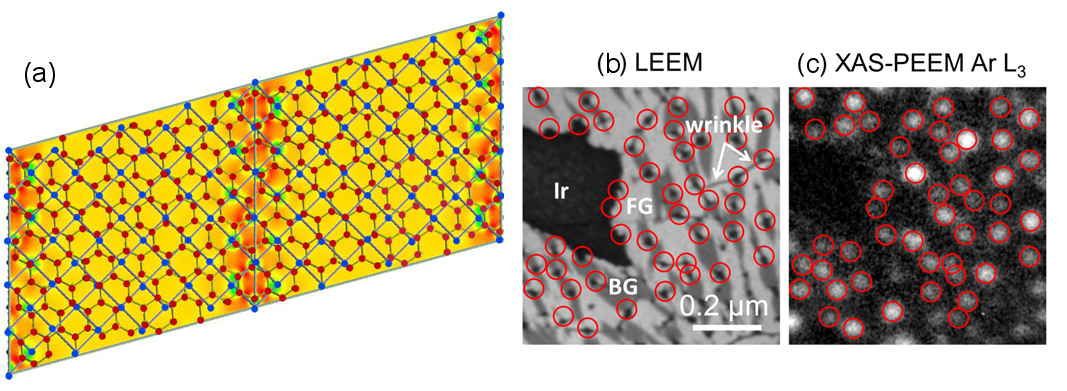
Figure 1: (a) Two contiguous unit cells of buckled graphene on Ir(001), as determined by ab initio calculations. (b) LEEM image of graphene/Ir(001) after Ar ion irradiation and subsequent annealing to 1050°C; the black dots correspond to Ar nanobubbles under graphene. (c) XAS-PEEM image of the same region. The intensity of the resulting image is proportional to the Ar concentration, with the bright regions corresponding to Ar clusters.
[1] A. Locatelli et al., ACS Nano 7, 6955 (2013).
[2] G. Zambrolini et al., Nano Lett. 15, 6162 (2015).
[3] These authors, in preparation.